Lecture 4 — From SNP to GWAS
Allele frequency and MAF · additive model · β, SE, OR · covariates · summary statistics · 5×10⁻⁸ · Manhattan and QQ plots · population structure · loci and QTLs
A genome-wide association study (GWAS) is one simple regression repeated about a million times. For each SNP you count how many copies of one allele each person carries (0, 1 or 2), regress the phenotype on that count, and record the effect size, its standard error and a p-value. That is the whole method; everything else in this lecture is about doing it carefully and reading the output correctly.
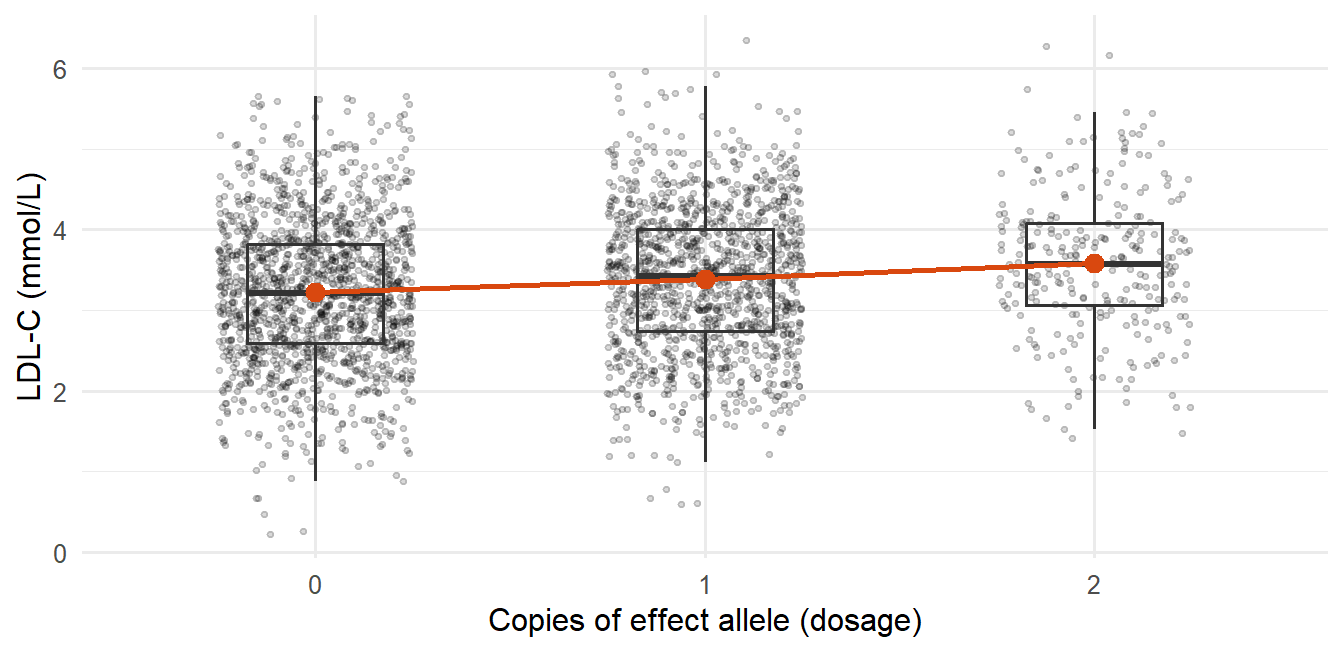
For example, if each copy of an allele raises LDL cholesterol by 0.2 mmol/L on average, the regression slope is 0.2. For a disease outcome you use logistic regression instead, and the slope becomes a log odds ratio.
The intuition to hold on to: genetic effects are usually small compared with everything else that varies between people, but with enough people you can still detect them. Testing a million SNPs at once also means you need a much stricter p-value threshold, and a significant SNP tells you where to look, not what is causal.
This page covers allele and genotype frequencies, the additive model for continuous and binary outcomes, covariates, GWAS summary statistics, multiple testing, Manhattan and QQ plots, why hits come in clusters, population structure and the step from a hit to biology. This lecture is calculation-heavy: be able to redo every worked example with new numbers.
NoteSources and session
Slides: “Lecture 4 from SNP to GWAS.pdf”. Remember that “Lecture 3_genetics.pdf” (Mendel, LD, SNP arrays, HWE) was presented at the start of this same session as a recap.
Assigned reading: Uffelmann E, Huang QQ, Munung NS, et al. Genome-wide association studies. Nature Reviews Methods Primers 2021;1:59. The most directly relevant academic reading for Lectures 4–6.
Exercise data mentioned (not needed here): Lecture4_ex1.csv and jointGwasMc_LDL.txt, a real LDL-C GWAS summary statistics file (~200 MB), reused in Lecture 5.
Rough plan: Week 2, day 2. From SNP to GWAS.
ImportantNo instructor EXAM tags in this lecture
None of the Lecture 4 slides carry the “EXAM” marker. The 📌 flags below are inferred: the lecture is built around worked calculations (MAF → genotype frequencies, log β → OR, allele frequency → genotype frequency for rs11591147), so being able to redo them with other numbers is high-priority prep.
4.1 Genotype → phenotype, and why association is not causation
DNA variation can plausibly cause a phenotype (disease status, a biomarker level). The reverse is logically impossible: a phenotype or disease cannot change your inherited DNA sequence, which was fixed at conception, long before any adult disease.
This directional certainty is exactly why genetic variants are useful for causal inference (Mendelian randomization, Lecture 6). But finding a variant associated with a phenotype is still only an association: confounding, chance and linkage can all produce a spurious-looking association, so causality still has to be investigated.
4.2 SNPs, alleles, MAF and genotype frequencies
At a given position, the nucleotide is sometimes A and sometimes C across people: a SNP. You can refer to it by base-pair position or by its rs number. The two possible nucleotides are its alleles.
MAF (minor allele frequency) is the frequency of the less common allele. By convention the minor allele is often called “the mutant”, but that is a labeling choice: the rarer allele is not necessarily the harmful one.
With C as reference, each person carries 0, 1 or 2 copies of the non-reference allele A:
| Genotype | Copies of A | |
|---|---|---|
| CC | 0 | homozygous reference |
| CA | 1 | heterozygous |
| AA | 2 | homozygous |
WarningAlways know which allele is the reference
Flipping the reference allele flips the sign of every downstream effect estimate.
Worked example: MAF → genotype frequencies (the HWE calculation from Lecture 3 applied). MAF = 10%: \(P(A) = 0.1\), \(P(C) = 0.9\).
| Genotype | Probability | Frequency | Out of 10,000 people |
|---|---|---|---|
| CC | \(0.9 \times 0.9\) | 0.81 | ≈ 8,100 |
| AC | \(0.9 \times 0.1 + 0.1 \times 0.9\) | 0.18 | ≈ 1,800 |
| AA | \(0.1 \times 0.1\) | 0.01 | ≈ 100 |
The homozygous-minor group is always the rarest when MAF is low, since its probability is MAF², which shrinks fast.
Worked example: how a genetic effect shows up among cases. Same population. The minor allele doubles the risk of disease Y per copy; baseline risk in CC is 5%.
| Genotype | People | Risk | Diseased | Share of all diseased |
|---|---|---|---|---|
| CC | 8,100 | 5% | ≈ 405 | 67% |
| AC | 1,800 | 10% (×2) | ≈ 180 | 30% |
| AA | 100 | 20% (×4) | ≈ 20 | 3.3% |
| Total | 10,000 | ≈ 605 | 100% |
Frequency of allele A among the diseased: \((180 + 2 \times 20)/(2 \times 605) \approx 18\%\), compared with 10% in the population.
Key takeaway: among people with the disease, the risk allele is enriched relative to the general population. That case–control asymmetry is exactly the signal a GWAS detects.
1,000
800
200
40
P(minor homozygote) = MAF² = 0.2² = 0.04, and 0.04 × 5,000 = 200. For comparison, heterozygotes are 2 × 0.2 × 0.8 = 0.32, i.e. 1,600 people, and 1,000 is MAF × 5,000, which is not a genotype count.
4.3 Phenotype types and the per-allele effect
| Phenotype | Examples | Model |
|---|---|---|
| Continuous | Blood pressure, protein concentration, cholesterol, liver fat | Linear regression |
| Binary | MI yes/no, lung cancer yes/no, disease yes/no | Logistic regression |
Per-allele effect. In a large population, group people by how many copies of an allele they carry (0/1/2) and compare the phenotype across groups. Background assumption: other factors that affect the phenotype (lifestyle, etc.) are randomly distributed with respect to genotype. If that fails, you have confounding.
Real example: PNPLA3 rs738409 (I148M) and liver fat. Found in 2009, linked to increased liver fat, roughly 4–5% higher liver fat per copy of the risk allele.
Continuous outcome, linear regression
\[y_i = \beta_0 + \beta_1 \times \text{allele}_i + \varepsilon_i\]
For each extra copy of the effect allele, the phenotype changes by \(\beta_1\) units on average.
Worked example: log-scale β. PNPLA3 rs738409, C→G, “per G allele” \(\beta = 0.08\) in \(\log_{10}\)(liver fat).
| Genotype | Log scale | Back-transformed | Interpretation |
|---|---|---|---|
| CG (1 copy) | \(0.08\) | \(10^{0.08} \approx 1.20\) | ≈ 20% higher liver fat |
| GG (2 copies) | \(0.16\) | \(10^{0.16} = 1.2^2 \approx 1.45\) | ≈ 45% higher liver fat |
On a log scale, effects combine multiplicatively on the original scale: two copies do not double the percentage, they square the factor.
Binary outcome, logistic regression
\[\log\left(\frac{p}{1-p}\right) = \beta_0 + \beta_1 \times \text{allele}\]
Same per-allele interpretation, on the log-odds scale.
Worked example: log-odds β → OR. rs7412, C→T, “per T allele” \(\beta = -0.16\).
| Genotype | Log-odds | Odds ratio |
|---|---|---|
| CT (1 copy) | \(-0.16\) | \(e^{-0.16} \approx \mathbf{0.85}\) |
| TT (2 copies) | \(-0.32\) | \(e^{-0.32} \approx \mathbf{0.73}\) |
WarningStill not causal
Even with a precise OR, you have not shown causality, mechanism or function, only a statistical association.
1.10
1.22
1.20
0.20
Two copies → 2 × 0.10 = 0.20 on the log-odds scale → OR = e^0.20 ≈ 1.22 (= 1.105²). The per-allele OR is e^0.10 ≈ 1.105.
4.4 The additive model: β, SE and p
The additive model (used for both phenotype types): compare the phenotype across the 0/1/2 groups, with each extra copy one unit of genotype dosage (the X variable).
| Continuous (linear) | Binary (logistic) | |
|---|---|---|
| β | Mean phenotype difference per extra allele (e.g. +0.2 mmol/L LDL-C, −1.9 mmHg) | Log-odds per allele; OR = exp(β) (β = −0.16 → OR = 0.85) |
| SE | Precision of β; depends on sample size, allele frequency and phenotype variability | Same dependencies |
| p-value | Evidence against \(H_0: \beta = 0\) | Evidence against \(H_0: \beta = 0\), i.e. OR = 1.00 |
“Worth noting” 1: genetic effects are small. The spread of phenotype values within each dosage group (from all the non-genetic factors) is usually much larger than the difference between group means. With a large enough sample you still detect the signal. GWAS is not about finding “the one cause”; hits are clues pointing to proteins involved in physiology or disease.
“Worth noting” 2: additive, dominant and recessive describe the genotype–phenotype relationship, not the allele. The same allele can act dominant for one phenotype and recessive for another. Most GWAS use additive models because they test many SNPs at once and the additive model is the simplest, most tractable default that works reasonably across all of them. Dominant/recessive models are more useful when studying one specific SNP or gene in depth.
4.5 Covariates
\[y = \beta_0 + \beta_1 G + \beta_2 X_1 + \dots + \beta_n X_{n-1} + \varepsilon\]
\(G\) is genotype dosage; the \(X\)s are covariates such as age, sex, BMI and genetic principal components (PC1, PC2, …).
Why covariates are needed
- Population structure. Allele frequency can differ between subpopulations, and the phenotype can also differ between them. Without adjustment you get a spurious SNP–phenotype association driven by structure, not biology (Section 4.9). The genetic principal components capture this.
- Age, sex (and BMI). Often strong direct determinants of the phenotype. Adjusting removes their influence and reduces residual noise/confounding.
- Technical variables. Genotyping batch, study center, or the batch/method used to measure the phenotype.
Warningβ is conditional on the covariates
The same SNP can have a somewhat different β in two studies that adjusted for different covariates. When comparing effect estimates across papers, check what was adjusted for.
4.6 The GWAS scan and summary statistics
GWAS = repeat the single-SNP regression separately for about 1,000,000 SNPs, one model per SNP, each adjusted, giving β, SE and p for every SNP. Conceptually simple but computationally heavy. Software: PLINK and regenie.
Practical notes: HG18 and HG19 are older reference genome versions (compare GRCh37/GRCh38 in Lecture 3). rsIDs refer to fixed variants but are not in genomic-position order, so sorting by rsID does not give positional order.
Standard columns in GWAS summary statistics
| Column | Meaning |
|---|---|
| SNP / rsID | Variant identifier |
| CHR | Chromosome |
| BP / POS | Genomic position (base pair) |
| A1 / EA | Allele 1 / effect allele, the allele β refers to |
| A2 / OE | The other allele |
| MAF / EAF | Minor allele frequency / effect allele frequency |
| Beta / OR | Estimated genetic effect |
| SE | Standard error |
| P | p-value |
| N | Sample size |
| SNP_hg18 | (sometimes) chromosome:position in the hg18 build |
| Freq.A1.1000G.EUR | (sometimes) frequency of A1 in the 1000 Genomes European reference panel, to cross-check allele frequencies |
β in summary statistics is usually the per-A1-allele effect, often in SD units (the phenotype was inverse-normal transformed or standardized first).
ImportantSummary statistics contain no individual-level data
Only per-SNP aggregates, which is why they can be shared much more freely than genotype data. When using them, always know: which allele is the effect allele, whether β is OR or log(OR) for binary outcomes, the scale of the phenotype (log? SD units?) and the genome build.
Each C allele lowers LDL-C by 0.05 SD on average
Each T allele lowers LDL-C by 0.05 SD on average
People with the T allele have 5% lower LDL-C in total
The SNP explains 5% of the variance in LDL-C
β is the per-effect-allele (A1) difference. A1 = T, so each extra T is associated with 0.05 SD lower LDL-C. Relative to C the direction is reversed, which is why knowing the effect allele matters.
4.7 Multiple testing, Manhattan and QQ plots
Testing ~1,000,000 SNPs at \(p < 0.05\) would give about \(1{,}000{,}000 \times 0.05 = 50{,}000\) false positives by chance. The field’s standard threshold is:
\[p < 5 \times 10^{-8} \approx \frac{0.05}{1{,}000{,}000}\]
a Bonferroni-style correction for ~1 million independent tests (Bonferroni is formalized in Lecture 7). Significance at this level means a SNP is statistically robust, not that it is biologically important or has a large effect.
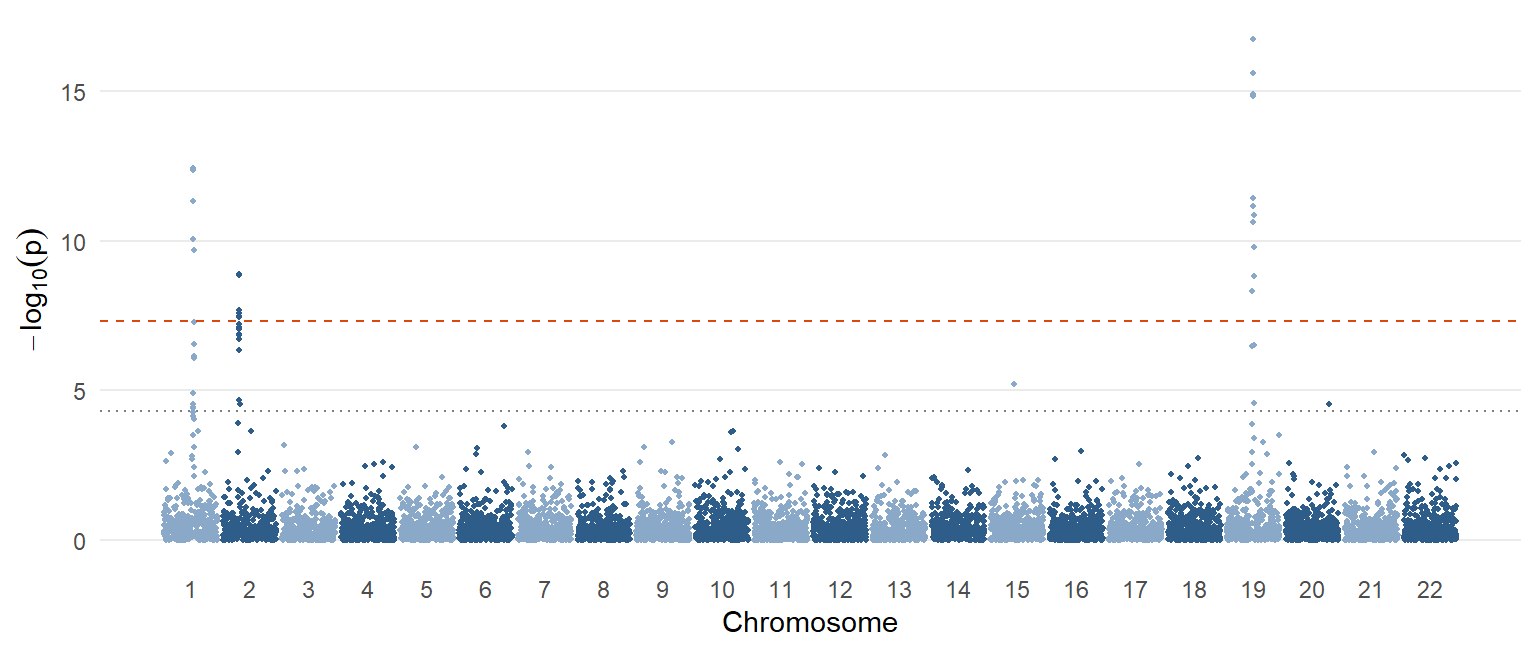
Manhattan plot. x-axis: genomic position ordered by chromosome; y-axis: \(-\log_{10}(p)\), so stronger associations are taller (“skyscrapers”). Each dot is one SNP. Horizontal lines usually mark a suggestive threshold (~5×10⁻⁵ or similar) and genome-wide significance (5×10⁻⁸).
WarningTwo interpretive caveats (stated explicitly in the slides)
- A Manhattan plot shows where the strongest associations are. It does not tell you which variant or gene is causal.
- A low p-value does not mean a large effect. With a huge sample, even a tiny effect reaches genome-wide significance.
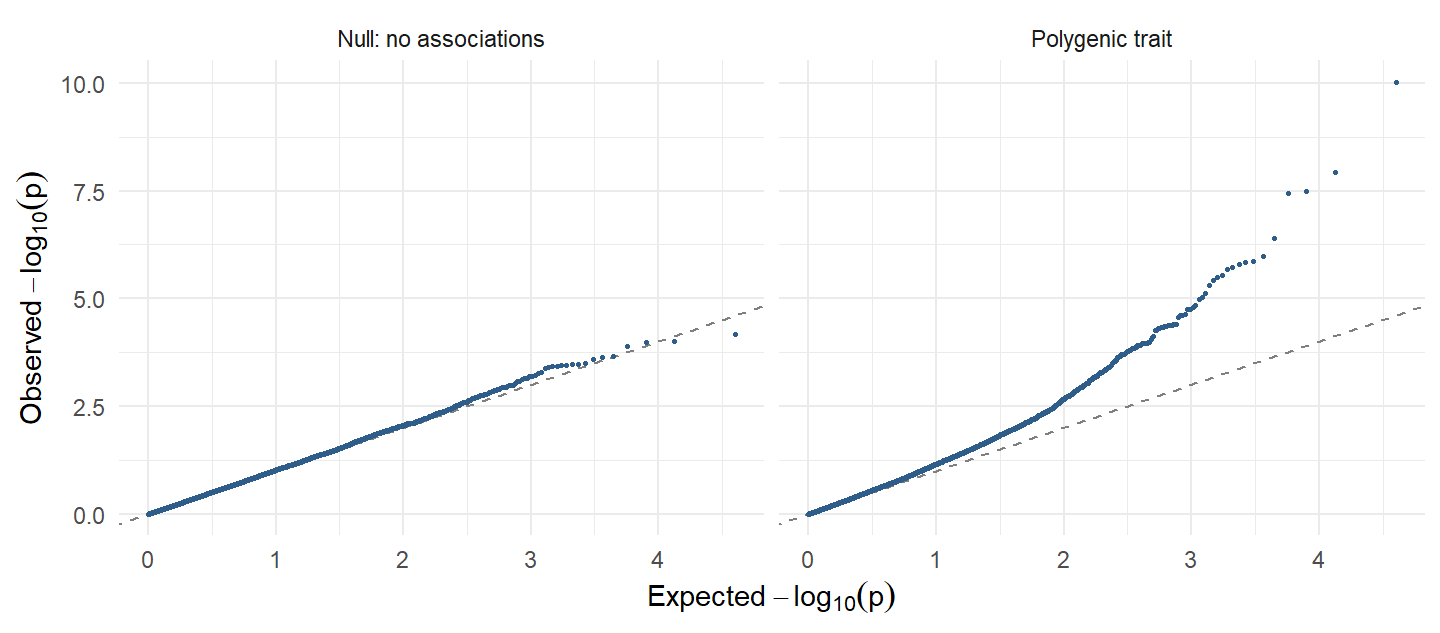
QQ plot. Observed p-values plotted against those expected under the null (no association anywhere). Points bending away from the diagonal more than chance predicts can signal a systematic problem (uncontrolled population structure, technical/batch artifacts). But it can also mean the trait is highly polygenic: very many small effects spread across the genome. That is the lecture’s explanation for LDL-C’s QQ plot looking “a bit off”: benign and expected for a polygenic trait.
The SNP must have a large effect on the phenotype
The SNP is the causal variant at this locus
The association is statistically robust, nothing more
The SNP explains a large share of phenotype variance
A tiny p-value in a huge sample only says the association is unlikely to be chance. Effect size, causality and variance explained are separate questions (see rs11591147 in Section 4.10).
4.8 Why one signal gives a cluster: lead SNP and r²
Nearby SNPs are correlated (in LD) because they are inherited together. So one true causal variant appears as many associated SNPs: every SNP in LD with it shows an association, not because it is independently causal but because it is correlated. If two SNPs are in LD, knowing one tells you about the other. The result is one peak in the Manhattan plot.
From the cluster you pick a representative, the lead SNP: usually the one with the smallest p-value. The lead SNP is not guaranteed to be the causal variant; it may just be a good proxy.
Quantifying LD: \(r^2\), the squared correlation between two SNPs’ genotypes (0 to 1).
| \(r^2\) | LD strength |
|---|---|
| > 0.8 | Very strong LD; close proxy |
| > 0.5 | Moderate to strong |
| < 0.1 | Weak |
| ≈ 0 | Essentially independent |
Downstream analyses usually need independent variables, which raises the questions of how to find independent signals and the causal variant in a correlated cluster (Lecture 5), and the complication that the causal variant might not even be measured on the array.
4.9 Population structure and confounding
The problem. If ancestry-related differences in allele frequency coincide with differences in the phenotype across subpopulations (different countries, or distinct communities such as the Amish), a SNP can look associated with the phenotype even with no biological effect at all.
| Frequency of allele G | Mean LDL-C | |
|---|---|---|
| Population A | Higher | Higher |
| Population B | Lower | Lower |
| Pooled analysis | G looks associated with higher LDL-C, purely through the confounding, whatever G’s real effect |
Standard mitigation strategies (likely asked as “how do you address population stratification in a GWAS?”):
- Restrict the analysis to genetically homogeneous ancestry groups.
- Adjust for genetic principal components (PC1, PC2, …).
- Account for relatedness with mixed models (e.g. regenie).
- Check the QQ plot and genomic inflation as a diagnostic.
Adjusting for genetic principal components
Restricting to one homogeneous ancestry group
Using mixed models that account for relatedness
Lowering the significance threshold to p < 0.05
Stratification is confounding; a different p-value threshold does not remove it. The standard tools are homogeneous samples, PC adjustment, mixed models (e.g. regenie) and QQ/inflation checks.
4.10 From hit to biology: locus, lead SNP, QTLs
| Term | Definition |
|---|---|
| SNP | One specific variant |
| Locus | A genomic region containing one or more associated variants (often one Manhattan peak) |
| Lead SNP | The SNP with the smallest p-value within that locus |
Worked example: rs11591147. β = −0.5 mmol/L LDL-C per T allele, a very strong effect. Allele frequency of T is only 1.5%.
| Genotype | Mean LDL-C | Frequency (HWE) |
|---|---|---|
| GG | 3.0 mmol/L | \(0.985^2 \approx 0.970\) |
| GT | ≈ 2.5 mmol/L | \(2 \times 0.985 \times 0.015 \approx 0.03\) (3%) |
| TT | ≈ 2.0 mmol/L | \(0.015^2 = 0.000225\) (0.023%) |
Lesson: a variant can have a large per-allele effect yet explain very little population-level variance because it is rare. Effect size and population relevance are different things; consider both.
Quantitative trait locus (QTL): a genomic region where genetic variation is associated with variation in a quantitative trait. More broadly, QTL analysis asks whether a variant can be linked to any measurable molecular trait: gene expression, protein level, metabolite level.
Protein QTL (pQTL): is the SNP near the gene encoding the protein (cis-pQTL) or elsewhere in the genome (trans-pQTL)? Developed in Lecture 8 (Section 8.9).
ImportantGWAS gives associations, not yet causality
GWAS gives you: a variant–phenotype association, an effect size, a p-value and a locus.
GWAS does not tell you: which SNP in the locus is causal, which gene is causal, which pathway is involved, or whether changing the molecular trait would change disease risk.
GWAS is a discovery tool. Causal inference needs extra assumptions and methods: Mendelian randomization (Lecture 6).
Practice
NoteRedo the worked calculations with your own numbers
Runs in your browser. Change the inputs and rerun.
Tasks
- Set
maf <- 0.015(rs11591147). What share of the population are heterozygotes and minor homozygotes? - Keep
maf <- 0.10but setrisk_ratio <- 1.2. How much of the case enrichment is left? - A GWAS reports OR = 1.30 per allele. What is β? What OR do you expect for two copies?
TipModel answer
- het ≈ 0.0296 (3%), alt_hom = 0.000225 (0.023%).
- The risks become 5%, 6% and 7.2%, and the shares of cases become about 78%, 21% and 1.4%, barely different from the population shares (81%, 18%, 1%). Smaller effects give smaller case–control differences, so you need larger samples to detect them.
log(1.30)≈ 0.262. Two copies:exp(2 * log(1.30))= 1.30² = 1.69.
Why-questions
TipWhy is 5×10⁻⁸ the genome-wide threshold?
It is roughly 0.05 / 1,000,000: a Bonferroni correction for about a million independent common-variant tests across the genome. With p < 0.05 you would expect ~50,000 false positives.
TipWhy do GWAS use the additive model?
It is the simplest, most tractable model that works reasonably across a million tests. Dominant or recessive models make sense when you study one gene in depth. “Dominant” is a property of the genotype–phenotype relationship, not of the allele.
TipWhy can a highly significant SNP matter little for public health?
Significance depends on sample size. A rare variant (like rs11591147, 1.5%) can have a big per-allele effect but affect few people; a common variant with a tiny effect can be extremely significant in a million-person GWAS yet barely change anyone’s risk.
TipWhy does a QQ plot that lifts off the diagonal not always mean a problem?
Both confounding (population structure, batch effects) and genuine polygenicity inflate many test statistics. For a highly polygenic trait like LDL-C, the lift is expected.
Spaced review
The physical distance between two genes in base pairs
Non-random association of alleles at different loci
The chance that a gamete carries a dominant allele
The frequency of recombination during mitosis
LD is the non-random association of alleles at different loci in a population, detected by comparing observed with expected haplotype frequencies.
A position that depends on the genome build used
A reference transcript version in NCBI RefSeq
A stable variant identifier in the dbSNP database
A protein sequence in the NP_ reference series
rs numbers are dbSNP identifiers and do not change between builds, unlike genomic coordinates (GRCh37 vs GRCh38).
Further reading
Reading
- Uffelmann E, Huang QQ, Munung NS, et al. Genome-wide association studies. Nature Reviews Methods Primers 2021;1:59. The most directly relevant reading for Lectures 4–6; worth reading in full.
- The genetics recap at the start of the session uses the Lecture 3 reading (Mendel, linkage, Hardy–Weinberg): see Lecture 3, Further reading.