C1 β€” Logistic Regression

1 Concept: Classification and the Logistic Model

1.1 From regression to classification

In classification the outcome \(Y\) is categorical. For binary \(Y \in \{0, 1\}\), we model the probability of belonging to class 1:

\[p(\mathbf{x}) = P(Y = 1 \mid \mathbf{X} = \mathbf{x})\]

We then classify: \(\hat{Y} = 1\) if \(\hat{p}(\mathbf{x}) > 0.5\) (or another threshold).

1.2 The logistic model

Logistic regression models \(p(\mathbf{x})\) via the logit link:

\[\log\frac{p(\mathbf{x})}{1 - p(\mathbf{x})} = \beta_0 + \beta_1 x_1 + \cdots + \beta_p x_p\]

Equivalently:

\[p(\mathbf{x}) = \frac{e^{\mathbf{x}^\top\boldsymbol{\beta}}}{1 + e^{\mathbf{x}^\top\boldsymbol{\beta}}}\]

The coefficients \(e^{\beta_j}\) are odds ratios β€” the multiplicative change in odds of \(Y=1\) per unit increase in \(x_j\).

1.3 Class imbalance

When one class is rare (e.g., only 11% have \(Y=0\) in SWP_CTW), a naive classifier that always predicts the majority class achieves high accuracy but is useless. Alternatives:

  • Use sensitivity and specificity instead of accuracy
  • Report AUC (area under the ROC curve)
  • Adjust the decision threshold away from 0.5
  • Resample: oversample the minority class (SMOTE) or undersample the majority

2 Quiz

Linear regression cannot handle binary outcomes mathematically
Linear regression can predict outside [0,1] and assumes a linear effect on probability, not on the log-odds
Logistic regression always gives better predictions than linear regression for binary outcomes
Linear regression requires normally distributed errors, which binary outcomes violate in the coefficients
Linear regression fitted to a binary outcome (the 'linear probability model') can give predicted probabilities <0 or >1 and has heteroskedastic errors. More fundamentally, the effect of a predictor on probability should be non-linear: near p=0 or p=1, a unit change in X should have little effect; near p=0.5 the effect is largest. The logit link captures this non-linearity correctly.
Accuracy of 89% is always considered a good model
It never identifies the at-risk 11% β€” sensitivity for SWP=0 is zero; the minority class is ignored
The model is overfit because training and test accuracy are both 89%
Accuracy is only valid when classes are perfectly balanced
With 89% majority class, predicting '1' for everyone achieves 89% accuracy with zero insight. In occupational health, correctly identifying the 11% who do NOT sustain work (SWP=0) is exactly the clinical goal β€” those are the people needing intervention. Sensitivity (recall for the minority class) and AUC are far more informative than accuracy in imbalanced settings.
OR = 0.08 β€” a one-unit increase in CTW multiplies the odds of SWP=1 by 0.08
OR = exp(0.08) β‰ˆ 1.08 β€” a one-unit increase in CTW multiplies the odds of SWP=1 by 1.08
OR = 0.08 + 1 = 1.08 β€” odds increase by 8 percentage points
OR = exp(0.08)Β² β€” the OR must be squared for binary outcomes
The log-odds is linear in X with slope Ξ². A one-unit increase in CTW changes the log-odds by 0.08, which means the odds are multiplied by exp(0.08) β‰ˆ 1.083. Since CTW ranges ~66–118, a 10-unit increase gives OR = exp(0.8) β‰ˆ 2.23 β€” the odds of SWP=1 more than doubles. Always report OR = exp(Ξ²) with a confidence interval [exp(Ξ² βˆ’ 1.96Β·SE), exp(Ξ² + 1.96Β·SE)].

3 Worked Example: Predicting Sustainable Work Participation

cat("Dataset: SWP_CTW β€” Sustainable Work Participation\n")
Dataset: SWP_CTW β€” Sustainable Work Participation
cat("n =", nrow(swp), " | Outcome: SWP (1 = sustains work)\n")
n = 10000  | Outcome: SWP (1 = sustains work)
cat("\nClass distribution:\n")

Class distribution:
print(table(SWP = swp$SWP))
SWP
   0    1 
1103 8897 
cat("\nClass balance:", round(mean(swp$SWP == 1) * 100, 1), "% SWP=1\n")

Class balance: 89 % SWP=1
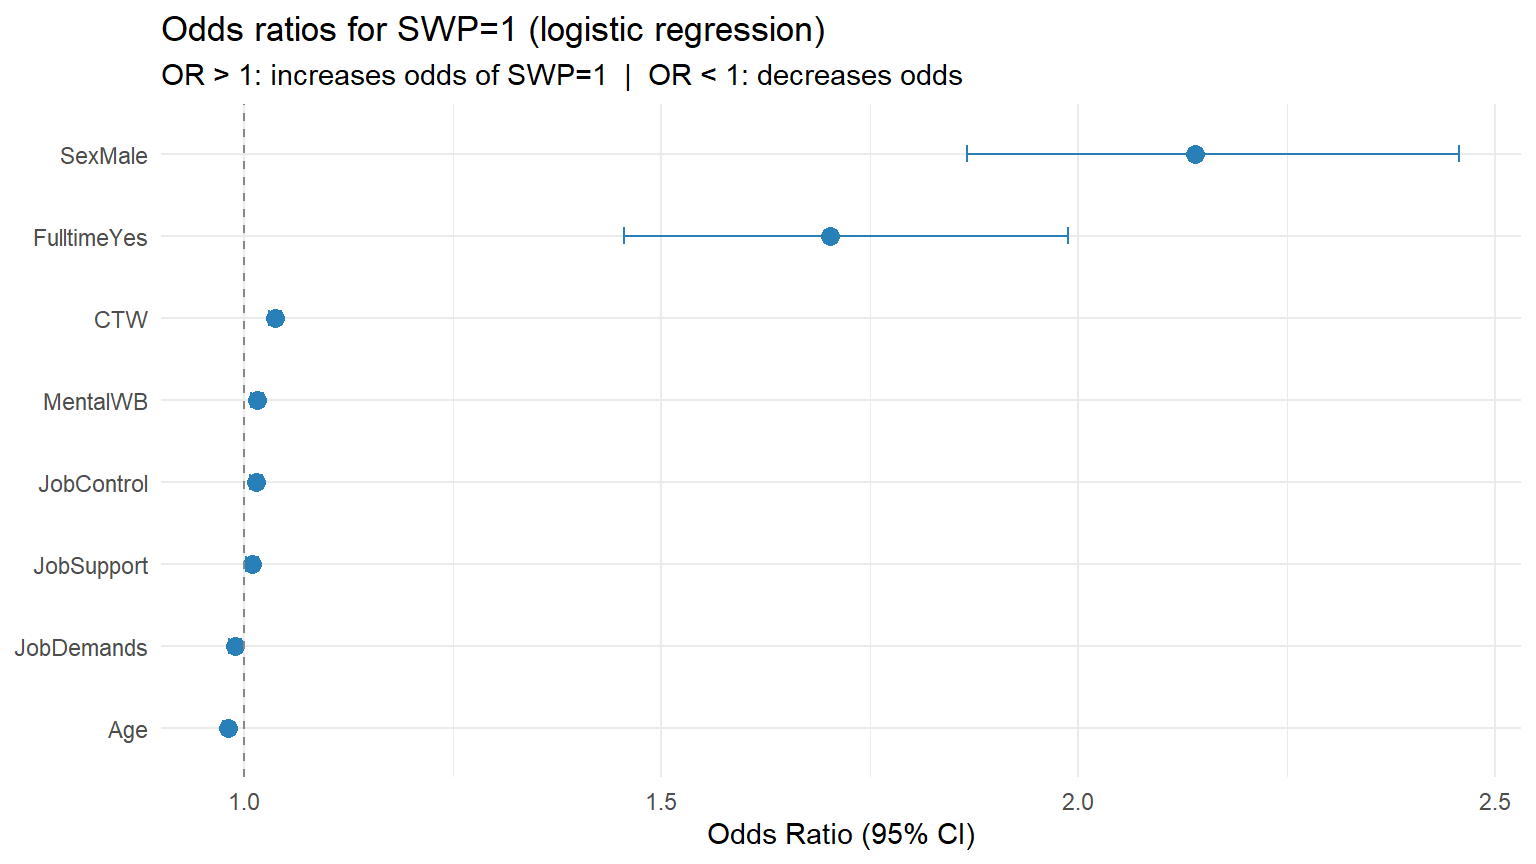
fit <- glm(SWP ~ Age + Sex + Fulltime + CTW + JobDemands + JobControl +
             JobSupport + MentalWB, data = swp, family = binomial)
summary(fit)

Call:
glm(formula = SWP ~ Age + Sex + Fulltime + CTW + JobDemands + 
    JobControl + JobSupport + MentalWB, family = binomial, data = swp)

Coefficients:
             Estimate Std. Error z value Pr(>|z|)    
(Intercept) -4.165661   0.727417  -5.727 1.02e-08 ***
Age         -0.019749   0.002914  -6.778 1.22e-11 ***
SexMale      0.760748   0.069982  10.871  < 2e-16 ***
FulltimeYes  0.532284   0.079393   6.704 2.02e-11 ***
CTW          0.036638   0.003627  10.102  < 2e-16 ***
JobDemands  -0.011014   0.003597  -3.062   0.0022 ** 
JobControl   0.014306   0.003404   4.203 2.63e-05 ***
JobSupport   0.009183   0.003551   2.586   0.0097 ** 
MentalWB     0.015792   0.003518   4.489 7.16e-06 ***
---
Signif. codes:  0 '***' 0.001 '**' 0.01 '*' 0.05 '.' 0.1 ' ' 1

(Dispersion parameter for binomial family taken to be 1)

    Null deviance: 6942.8  on 9999  degrees of freedom
Residual deviance: 6430.4  on 9991  degrees of freedom
AIC: 6448.4

Number of Fisher Scoring iterations: 5
# Odds ratios with 95% CI
or_df <- data.frame(
  variable = names(coef(fit))[-1],
  OR  = exp(coef(fit)[-1]),
  lower = exp(confint(fit)[-1, 1]),
  upper = exp(confint(fit)[-1, 2])
)
Waiting for profiling to be done...
ggplot(or_df, aes(x = reorder(variable, OR), y = OR)) +
  geom_point(size = 3, colour = "#2980b9") +
  geom_errorbar(aes(ymin = lower, ymax = upper), width = 0.2, colour = "#2980b9") +
  geom_hline(yintercept = 1, linetype = "dashed", colour = "#888") +
  coord_flip() +
  labs(title = "Odds ratios for SWP=1 (logistic regression)",
       subtitle = "OR > 1: increases odds of SWP=1  |  OR < 1: decreases odds",
       x = NULL, y = "Odds Ratio (95% CI)") +
  theme_minimal()

# Default threshold = 0.5
pred_prob <- predict(fit, type = "response")
pred_class <- ifelse(pred_prob > 0.5, 1, 0)

cm <- table(Predicted = pred_class, Actual = swp$SWP)
print(cm)
         Actual
Predicted    0    1
        0   10    5
        1 1093 8892
cat("\nAccuracy:   ", round(mean(pred_class == swp$SWP) * 100, 1), "%\n")

Accuracy:    89 %
cat("Sensitivity:", round(cm[2,2] / sum(cm[,2]) * 100, 1), "% (correctly identified SWP=1)\n")
Sensitivity: 99.9 % (correctly identified SWP=1)
cat("Specificity:", round(cm[1,1] / sum(cm[,1]) * 100, 1), "% (correctly identified SWP=0)\n")
Specificity: 0.9 % (correctly identified SWP=0)

4 Guided Practice

R is loading in the background β€” exercises below will be interactive once ready.

  • At threshold=0.5, sensitivity for SWP=0 is likely very low β€” why?
  • As you lower the threshold, sensitivity for SWP=0 increases but specificity decreases
  • This trade-off is exactly what the ROC curve (C6) visualises

5 Retrieval Challenge


6 Why-Questions

Yes, but with caution. With p=80 and n=10000, OLS-style logistic regression is technically feasible (n >> p), but many of those 80 variables may be redundant questionnaire items. Better to either (a) use penalised logistic regression (LASSO with glmnet, family=β€œbinomial”), or (b) first create composite scores (as was done here with CTW, JobDemands etc.) from the raw items. Blindly including all raw items risks overfitting and obscures interpretation.

NoteFurther reading

James et al. (2021). An Introduction to Statistical Learning. β€” Chapter 4.1–4.3