C2 β€” LDA & kNN

1 Concept: Generative Classifiers and Distance Methods

1.1 Linear Discriminant Analysis (LDA)

LDA models the class-conditional distributions \(P(\mathbf{X} \mid Y=k)\) as multivariate Gaussians with the same covariance matrix \(\boldsymbol{\Sigma}\). Via Bayes’ theorem, this gives a linear decision boundary. QDA relaxes equal-covariance, giving a quadratic boundary but estimating more parameters.

1.2 k-Nearest Neighbours (kNN)

kNN is non-parametric β€” no distributional assumption:

  1. For a new point \(\mathbf{x}_0\), find the \(k\) closest training points
  2. Assign the majority class among those neighbours

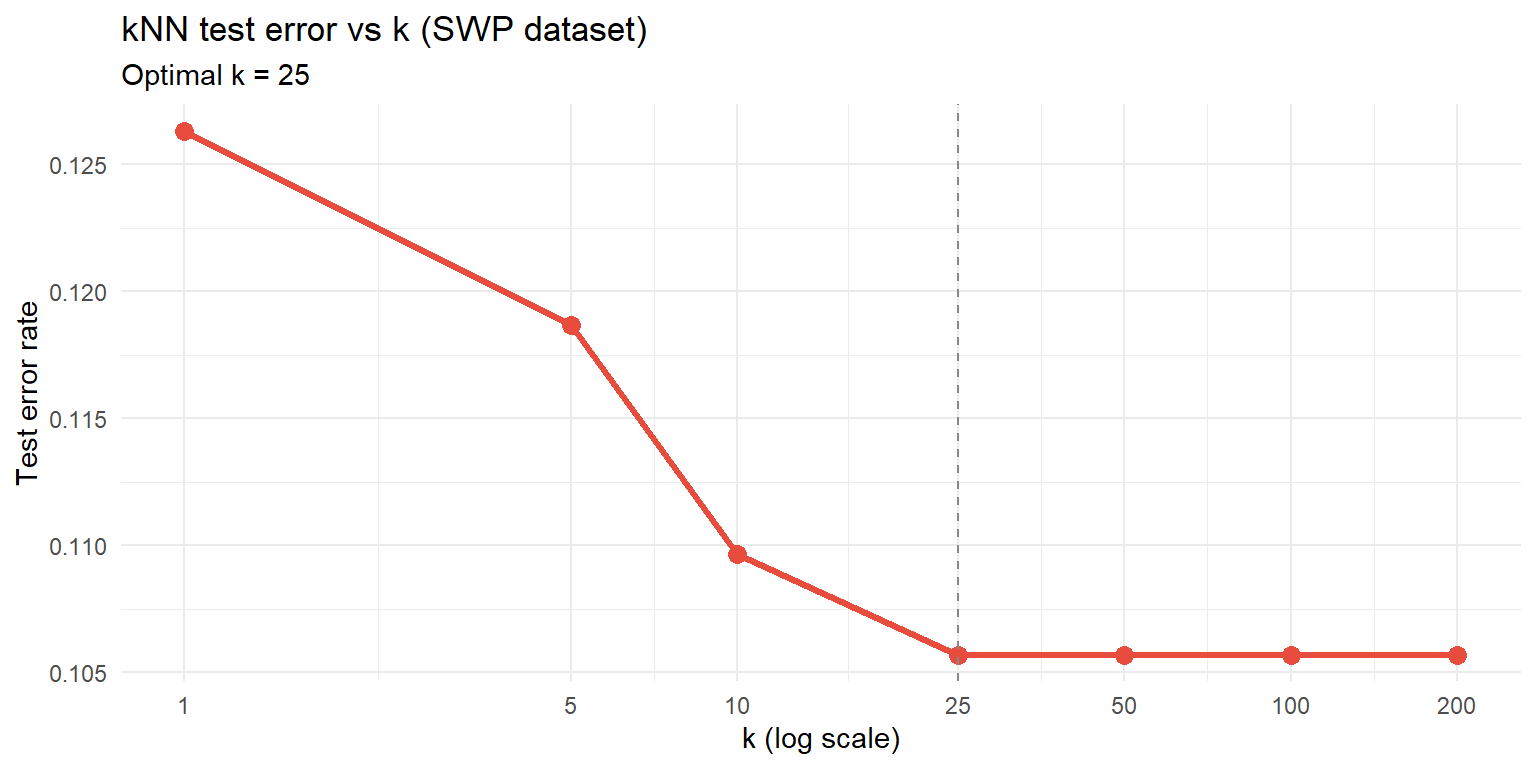
Small \(k\) = flexible, low bias, high variance. Large \(k\) = smooth, high bias, low variance. Optimal \(k\) found by cross-validation.

Method Boundary Assumption Scale-sensitive?
Logistic Linear None No
LDA Linear Gaussian, equal Ξ£ No
QDA Quadratic Gaussian, different Ξ£ No
kNN Non-linear None Yes β€” must standardise

2 Quiz

LDA becomes equivalent to logistic regression
LDA fails completely and cannot produce predictions
The linear boundary is misspecified β€” QDA or a flexible method may perform better
LDA automatically corrects by estimating separate covariance matrices
If classes have different covariance structures, the true Bayes boundary is quadratic, not linear. LDA's linear boundary will then be suboptimal. QDA estimates a separate Ξ£_k per class, giving a quadratic boundary. However, QDA has more parameters and needs more data. With limited data, LDA's lower variance may still outweigh the bias from the wrong boundary shape.
Zero β€” each training point is its own nearest neighbour
Equal to the Bayes error rate
Equal to 1/n
Undefined β€” kNN cannot be evaluated on training data
With k=1, every training point is its own nearest neighbour and is classified perfectly β€” training error is 0. This is extreme overfitting. Test error with k=1 is much higher. As k increases, the model smooths out and test error first falls then rises β€” the same U-shape as the bias-variance tradeoff.
kNN requires all predictors to follow a normal distribution so that Euclidean distance is valid
High-range predictors dominate Euclidean distance regardless of their actual predictive importance
Standardisation only speeds up computation β€” the same neighbours are found regardless of scale
kNN requires integer-valued predictors because Euclidean distance is undefined for continuous inputs
kNN uses Euclidean distance. If Age ranges 18–70 and JobControl ranges 85–120, a 1-unit difference in Age contributes more to distance than a 1-unit difference in JobControl β€” even if JobControl is more informative. Standardising (subtract mean, divide by SD) puts all predictors on equal footing and is essential before kNN.

3 Worked Example

lda_fit  <- lda(SWP ~ Age + CTW + JobDemands + JobControl + JobSupport + MentalWB,
                data = train)
lda_pred <- predict(lda_fit, newdata = test)
cm_lda   <- table(Predicted = lda_pred$class, Actual = test$SWP)
print(cm_lda)
         Actual
Predicted    0    1
        0    1    1
        1  316 2682
cat("\nTest accuracy:      ", round(mean(lda_pred$class == test$SWP)*100, 1), "%\n")

Test accuracy:       89.4 %
cat("Sensitivity (SWP=0):", round(cm_lda[1,1] / sum(cm_lda[,1])*100, 1), "%\n")
Sensitivity (SWP=0): 0.3 %
cat("Specificity (SWP=1):", round(cm_lda[2,2] / sum(cm_lda[,2])*100, 1), "%\n")
Specificity (SWP=1): 100 %
pred_vars <- c("Age","CTW","JobDemands","JobControl","JobSupport","MentalWB")
mu  <- colMeans(train[, pred_vars])
sds <- apply(train[, pred_vars], 2, sd)
X_tr <- scale(train[, pred_vars], center = mu, scale = sds)
X_te <- scale(test[, pred_vars],  center = mu, scale = sds)

# Use a subset for speed during rendering (n=7000 kNN is slow)
set.seed(7)
sub <- sample(nrow(X_tr), 1500)
X_tr_s <- X_tr[sub, ]; y_tr_s <- train$SWP[sub]

ks        <- c(1, 5, 10, 25, 50, 100, 200)
test_err  <- sapply(ks, function(k) mean(knn(X_tr_s, X_te, cl = y_tr_s, k=k) != test$SWP))

ggplot(data.frame(k = ks, error = test_err), aes(k, error)) +
  geom_line(colour="#e74c3c", linewidth=1.2) +
  geom_point(size=3, colour="#e74c3c") +
  geom_vline(xintercept=ks[which.min(test_err)], linetype="dashed", colour="#888") +
  scale_x_log10(breaks=ks) +
  labs(title="kNN test error vs k (SWP dataset)",
       subtitle=paste0("Optimal k = ", ks[which.min(test_err)]),
       x="k (log scale)", y="Test error rate") +
  theme_minimal()
logit    <- glm(SWP ~ Age + CTW + JobDemands + JobControl + JobSupport + MentalWB,
                data=train, family=binomial)
k_best   <- ks[which.min(test_err)]
knn_pred <- knn(X_tr_s, X_te, cl=y_tr_s, k=k_best)

cat("Test accuracy:\n")
Test accuracy:
cat("  Null (always SWP=1):    ", round(mean(test$SWP==1)*100,1), "%\n")
  Null (always SWP=1):     89.4 %
cat("  Logistic regression:    ", round(mean(ifelse(predict(logit,test,type="response")>0.5,1,0)==test$SWP)*100,1), "%\n")
  Logistic regression:     89.4 %
cat("  LDA:                    ", round(mean(lda_pred$class==test$SWP)*100,1), "%\n")
  LDA:                     89.4 %
cat("  kNN (k=", k_best, "):          ", round(mean(knn_pred==test$SWP)*100,1), "%\n")
  kNN (k= 25 ):           89.4 %

4 Guided Practice

R is loading in the background β€” exercises below will be interactive once ready.

NoteFurther reading

James et al. (2021). An Introduction to Statistical Learning. β€” Chapter 4.4 (LDA), Chapter 3.5 (kNN)