1.1 Supervised vs unsupervised — the key distinction
In Blocks 1 and 2 you always had a response variable Y: SBP to predict, disease to classify. Clustering has no Y. You observe \(\mathbf{X}\) and ask: are there natural subgroups in this data?
In STA220 you asked a related question: do HAD items group into depression and anxiety? Factor analysis answered this by finding latent dimensions. Clustering answers a different version: do patients group into distinct health profiles? No labels are assumed — the groups emerge from the data geometry.
1.2 The k-means algorithm
Given \(n\) observations and a chosen number of clusters \(K\), k-means minimises the total within-cluster sum of squares (WCSS):
where \(\boldsymbol{\mu}_k\) is the centroid (mean) of cluster \(k\).
Algorithm (Lloyd’s):
Randomly initialise \(K\) centroids
Assign each observation to the nearest centroid
Update each centroid as the mean of its assigned observations
Repeat steps 2–3 until assignments stop changing
The algorithm converges to a local minimum — not necessarily the global minimum. Always run with multiple random starts (nstart in R) and take the best result.
1.3 Choosing K — the elbow method
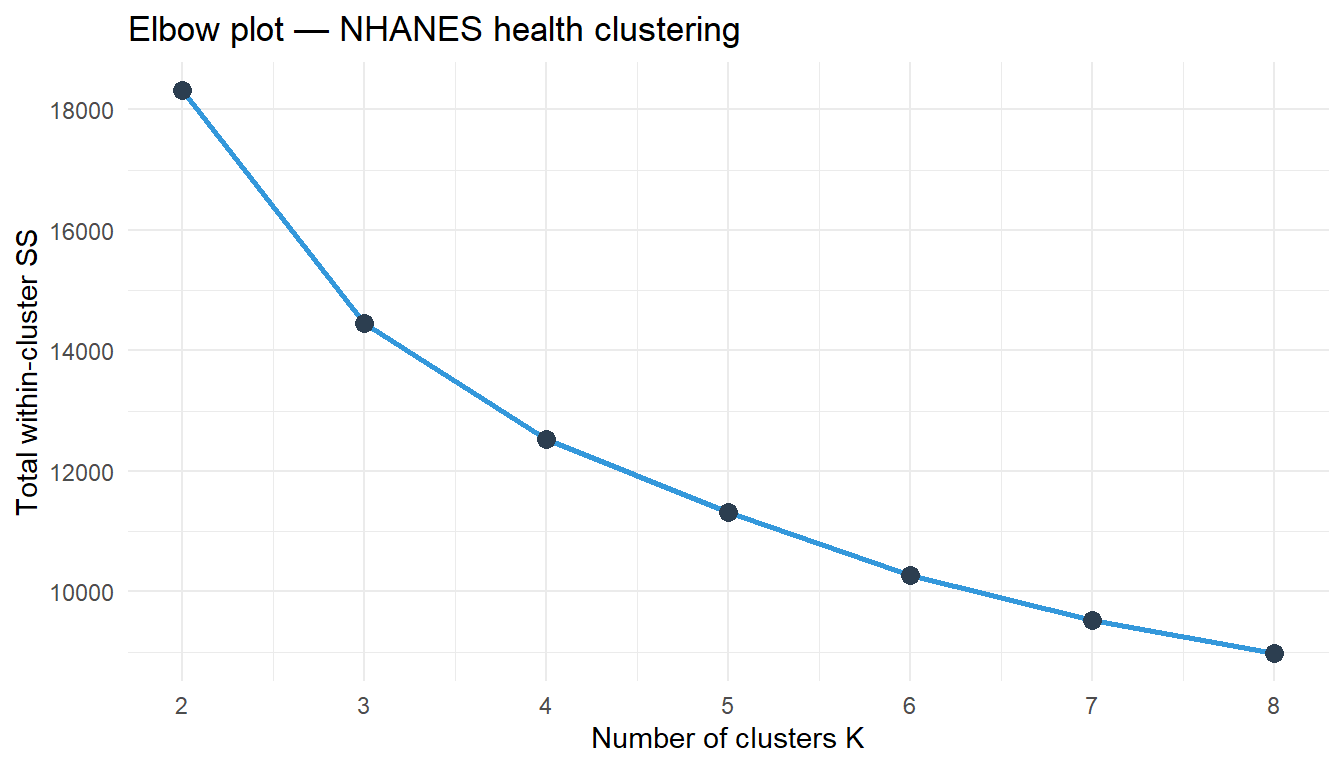
Run k-means for \(K = 1, 2, \ldots, K_{\max}\) and plot WCSS against \(K\). WCSS always decreases as \(K\) increases (more clusters = smaller groups = tighter fit). Look for an elbow — the point where the rate of decrease slows sharply.
There is no objectively correct \(K\). Domain knowledge matters: do you expect 2 patient profiles or 5? The elbow is a heuristic, not a rule.
1.4 Important: scale your variables
K-means uses Euclidean distance. If Age is measured in years (range 20–80) and Cholesterol in mmol/L (range 2–8), Age will dominate purely because of its larger scale. Always standardise before clustering.
2 Quiz
Clusters that are maximally separated from each other in space
Observations within each cluster are close to their centroid — compact and tightly grouped
Clusters of approximately equal size across all groups
Clusters whose observations follow a multivariate normal distribution
WCSS penalises observations that are far from their cluster centroid. Minimising WCSS makes clusters internally compact. It does not directly maximise between-cluster distance, though the two are related. Equal-size clusters and normality are not required — but k-means performs poorly when clusters are very unequal in size or non-spherical in shape.
k-means is inherently stochastic and cluster assignments never converge to any stable configuration
Random starting centroids lead to different local minima and different final cluster assignments
k-means randomly resamples the input data before each run, causing the cluster geometry to change
k-means requires at least K ≥ 5 clusters for the algorithm to converge to a reproducible assignment
With nstart = 1, k-means starts from one random set of centroids. Different starting points lead to different local minima. Always use nstart ≥ 20 and set.seed() for reproducibility. R's kmeans() returns the best result across all starts (lowest WCSS).
K-means cannot process four variables simultaneously — it is restricted to working with only two dimensions
K-means automatically forms perfectly spherical, equal-volume clusters regardless of variable scale
Large-scale SBP dominates Euclidean distance — clusters reflect blood pressure above all other variables
The algorithm will cycle indefinitely between inconsistent cluster assignments and never converge
Euclidean distance treats all dimensions equally in units. SBP (range ~110) contributes 110² ≈ 12000 to squared distance per unit change; BMI (range ~35) contributes 35² ≈ 1225. SBP numerically dominates. Standardise first so each variable has mean 0 and SD 1, giving equal weight to all variables.
3 Worked Example: Patient Health Profiles in NHANES
We cluster NHANES patients into groups based on their health profile — no outcome variable used.
set.seed(42)vars <-c("Age", "BMI", "Waist", "Cholesterol", "SBP")dat <-na.omit(nhanes[, vars])X <-scale(dat)# Run k-means for K = 2 to 8, record WCSSwcss <-sapply(2:8, function(k) {kmeans(X, centers = k, nstart =25)$tot.withinss})
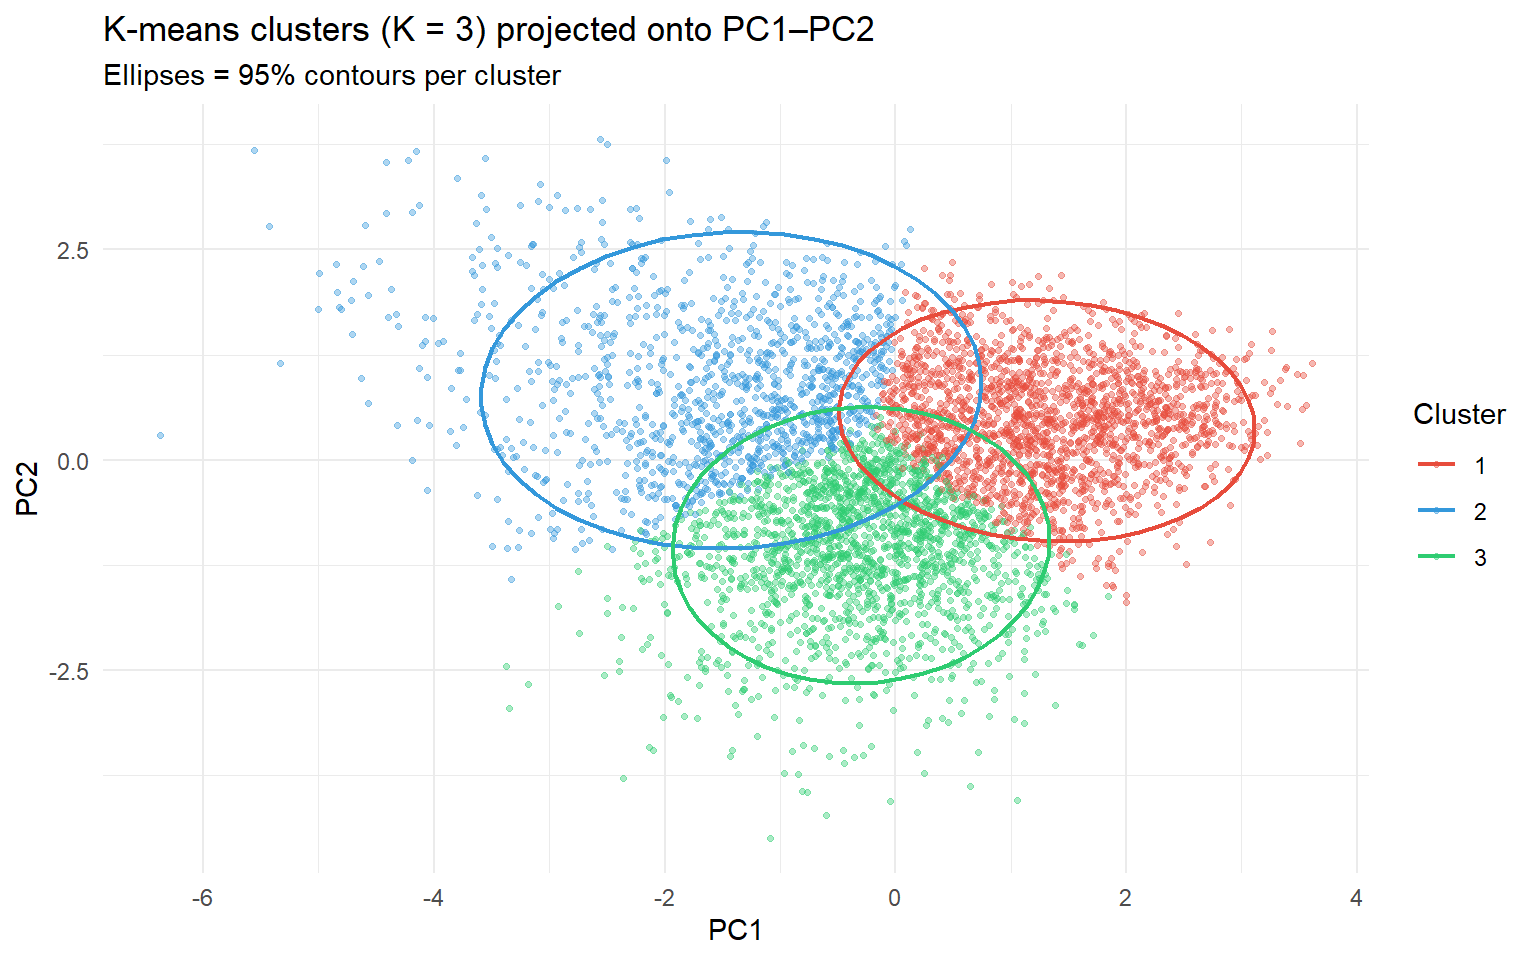
set.seed(42)km3 <-kmeans(X, centers =3, nstart =25)dat$cluster <-factor(km3$cluster)# Cluster means (back on original scale)aggregate(dat[, vars], by =list(Cluster = dat$cluster), FUN = mean) |>mutate(across(where(is.numeric), round, 1))
Warning: There was 1 warning in `mutate()`.
ℹ In argument: `across(where(is.numeric), round, 1)`.
Caused by warning:
! The `...` argument of `across()` is deprecated as of dplyr 1.1.0.
Supply arguments directly to `.fns` through an anonymous function instead.

  # Previously
  across(a:b, mean, na.rm = TRUE)

  # Now
  across(a:b, \(x) mean(x, na.rm = TRUE))
Interpretation: Three clusters emerge — broadly: younger healthy, middle-aged overweight, older hypertensive. These are data-driven profiles, not clinical diagnoses. The PC projection shows how well-separated the clusters are in the low-dimensional space found by PCA.
4 Guided Practice
R is loading in the background — exercises will be interactive once the status bar disappears.
TipHints
kmeans(X, centers = K, nstart = 25)$tot.withinss gives WCSS for a given K
Use aggregate() or group_by() |> summarise() to get cluster means
Look at each cluster’s mean Age, BMI, and SBP to give it a clinical label
There is no “correct” label — interpretation requires domain knowledge
5 Retrieval Challenge
TipModel Answer
library(ggplot2)ggplot(dat2, aes(BMI, SBP, colour = cluster)) +geom_point(alpha =0.3, size =0.7) +stat_ellipse() +scale_colour_manual(values =c("#e74c3c", "#3498db", "#2ecc71")) +labs(title ="K-means (K=3) on BMI and SBP only") +theme_minimal()# Compare: are the 2-variable clusters similar to the 5-variable clusters?# What information is lost by ignoring Age, Waist, Cholesterol?
6 Why-Questions
CautionQ: “Is cluster 1 really different from cluster 2? Maybe they just look different by chance.”
K-means always produces K clusters — even on completely random data. There is no built-in test for whether clusters are “real”. One approach: compare the WCSS improvement from K-1 to K against the same step in randomly permuted data (the gap statistic). Another: check if the cluster structure replicates in a held-out half of the data. In practice, assess clusters on clinical interpretability, not just WCSS.
CautionQ: “K-means gave my colleague different clusters on the same data. Is one of us wrong?”
Not necessarily. K-means can find different local optima on the same data, especially when clusters are not well-separated. Both solutions may be valid local minima. Solutions: (1) use set.seed() for reproducibility, (2) use nstart = 25 or more, (3) if results are very sensitive to initialisation, consider hierarchical clustering (next page) which is deterministic.
CautionQ: “Can I use K-means to validate the factor structure I found in STA220?”
Not directly — k-means clusters observations (patients), while factor analysis clusters variables (HAD items). But you can use PCA scores as input to k-means: run PCA on the HAD items → take the first two PC scores → run k-means on patients in that 2D space. Patients who score similarly on both the depression and anxiety dimensions will cluster together. This bridges the two methods.
NoteFurther reading
James et al. (2021). An Introduction to Statistical Learning. — Chapter 12.4