F4 โ€” Resampling Methods Overview

1 Concept: Resampling to Estimate Test Error

1.1 Why resampling?

We established that training error is optimistic. A single train/test split gives an unbiased but noisy estimate. Resampling methods use the available data more efficiently by repeatedly fitting models on subsets and averaging the results.

1.2 Three approaches

Method Idea Bias Variance Use when
Validation set Single 70/30 split Low High Very large n
k-fold CV Rotate through k folds Moderate Moderate Standard choice
LOOCV k = n Very low High Small n, cheap models
Bootstrap Sample with replacement Low Low Also estimates parameter uncertainty

1.3 k-fold cross-validation

  1. Randomly divide data into \(k\) equal folds
  2. For \(j = 1, \ldots, k\): fit model on all folds except \(j\), predict on fold \(j\)
  3. Average the \(k\) test errors: \(\text{CV}_{(k)} = \frac{1}{k}\sum_{j=1}^k \text{MSE}_j\)

Typical choices: \(k=5\) or \(k=10\). These balance bias (LOOCV has lowest) and variance (smaller \(k\) has lower variance because training sets are less similar).

1.4 The bootstrap

Draw \(B\) samples of size \(n\) with replacement from the training data. Fit the model on each bootstrap sample, evaluate on the original data (out-of-bag observations). Useful for estimating both test error and parameter uncertainty.


2 Quiz

5
20
80
100
n/k = 100/5 = 20 observations per test fold. Each fold is used exactly once as the test set. The model is trained on the remaining 80 observations and evaluated on the 20 held-out ones.
LOOCV uses just one observation per test fold, so each single-point MSE is unreliable and highly variable
Fold errors from near-identical training sets are correlated โ€” their average barely reduces variance
Averaging over n folds rather than 10 makes LOOCV's final estimate much less stable than 10-fold CV
LOOCV systematically overestimates bias for nonlinear models due to the extreme n-1 training size
In LOOCV, each training set of size nโˆ’1 differs from the others by just one observation. This means the n model fits (and their errors) are nearly identical โ€” highly correlated. Averaging correlated estimates barely reduces variance. In 10-fold CV the 10 test sets are more distinct, giving less correlated estimates and lower variance of the CV estimate.

3 Worked Example

library(ggplot2)
set.seed(42)
f_true <- function(x) sin(pi * x)
n <- 80
x <- sort(runif(n, 0, 1))
y <- f_true(x) + rnorm(n, 0, 0.4)

# Manual 10-fold CV
k <- 10
folds <- sample(rep(1:k, length.out=n))
degrees <- 1:10

cv_mse <- sapply(degrees, function(d) {
  fold_errs <- sapply(1:k, function(j) {
    tr <- which(folds != j)
    te <- which(folds == j)
    fit <- lm(y[tr] ~ poly(x[tr], d))
    xp  <- poly(x[te], d, coefs=attr(poly(x[tr], d), "coefs"))
    mean((y[te] - cbind(1, xp) %*% coef(fit))^2)
  })
  mean(fold_errs)
})

res <- data.frame(degree=degrees, cv_mse=cv_mse,
                  train_mse=sapply(degrees, function(d)
                    mean(residuals(lm(y ~ poly(x, d)))^2)))

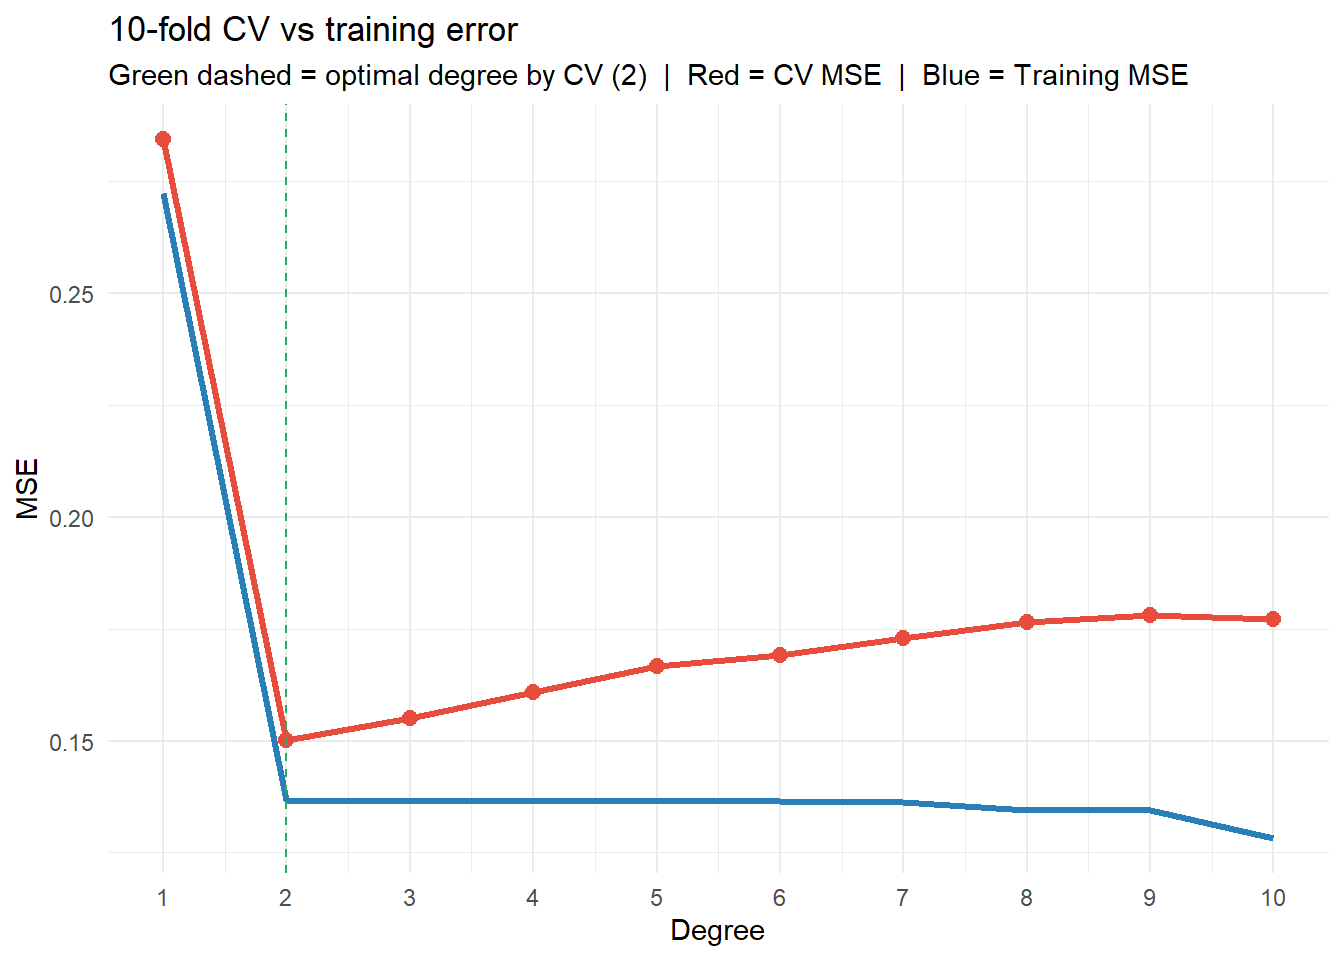
ggplot(res, aes(x=degree)) +
  geom_line(aes(y=train_mse), colour="#2980b9", linewidth=1.2) +
  geom_line(aes(y=cv_mse),   colour="#e74c3c", linewidth=1.2) +
  geom_point(aes(y=cv_mse), colour="#e74c3c", size=2.5) +
  geom_vline(xintercept=degrees[which.min(cv_mse)],
             linetype="dashed", colour="#27ae60") +
  scale_x_continuous(breaks=degrees) +
  labs(title="10-fold CV vs training error",
       subtitle=paste0("Green dashed = optimal degree by CV (", degrees[which.min(cv_mse)], ")  |  Red = CV MSE  |  Blue = Training MSE"),
       x="Degree", y="MSE") +
  theme_minimal()

4 Guided Practice

R is loading โ€” exercises interactive once ready.

NoteFurther reading

James et al. (2021). An Introduction to Statistical Learning. โ€” Chapter 5